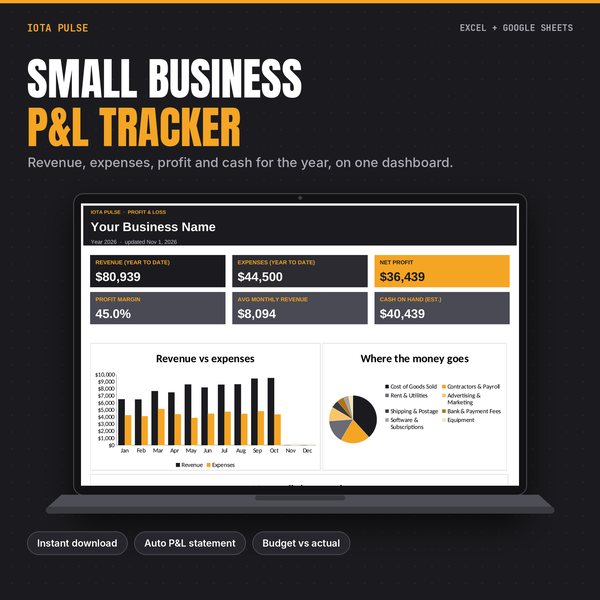
Know if your business is actually making money. Log each sale and expense once, and this profit and loss tracker builds your monthly P&L statement, compares spending to budget and charts the whole year for you.
What'S Inside (6 Tabs)
- Start Here: setup steps and a colour key.
- Dashboard: revenue, expenses, net profit, profit margin, average monthly revenue and estimated cash on hand, plus charts for revenue vs expenses, where the money goes, and net profit by month.
- Transactions: a 1,000-row log. Pick a category from the dropdown and type the amount; income vs expense is decided for you.
- Monthly P&L: a full profit and loss statement, January to December, by category, with totals, margin and running cash.
- Budget vs Actual: year-to-date spend for each expense category against its monthly budget, flagged On track, Close or Over.
- Setup: business name, year, starting cash, up to 8 income and 22 expense categories with optional budgets.
Who It'S For
How To Use It
- Excel: open the .xlsx file (Excel 2010 or newer, Windows or Mac).
- Google Sheets: upload the .xlsx to Google Drive, open it, then choose File > Save as Google Sheets.
- Start on the "Start Here" tab. Pale amber cells are where you type; grey cells calculate automatically.
- Example data is included so you can see every chart working. Select it and press Delete when you're ready.
Good To Know
- This is a digital download. Nothing physical ships.
- No macros, add-ins or scripts. Formulas use standard functions that work in both Excel and Google Sheets.
- Every tab is set up to print on Letter or A4.
- Personal use, or use within your own business. Please don't resell or share the file.
A record-keeping and planning tool. It does not replace an accountant and is not tax or legal advice.